レースメニュー
閉じる
| FP | BK | PP |
Horse
|
A&S | Wgt | Jockey | Fin. Time | Margin |
Odds
|
Trainer | Horse (Wgt) |
|---|---|---|---|---|---|---|---|---|---|---|---|
|
1
|
5
|
5
|
4G |
57.0
|
C.Lemaire |
|
|
S.KuniedaMiho | 486(-4) | ||
|
1
|
6
|
8
|
3C |
54.0
|
Y.Tannai |
|
|
|
K.OgataMiho | 482(-8) | |
|
3
|
6
|
7
|
5M |
55.0
|
K.Tosaki |
|
|
|
S.KojimaMiho | 434(+4) | |
|
4
|
5
|
6
|
4H |
57.0
|
T.Yokoyama |
|
|
|
K.MinaiRitto | 476(-6) | |
|
5
|
8
|
12
|
6H |
57.0
|
S.Ishibashi |
|
|
|
R.TakahashiRitto | 456(-2) | |
|
6
|
1
|
1
|
5H |
57.0
|
A.Sugawara |
|
|
|
T.KuritaMiho | 480(+16) | |
|
7
|
7
|
9
|
3C |
54.0
|
H.Tanabe |
|
|
|
Y.TomomichiRitto | 496(+6) | |
|
8
|
7
|
10
|
7H |
57.0
|
T.Ono |
|
|
|
Y.WadaMiho | 480(+2) | |
|
9
|
3
|
3
|
4H |
57.0
|
K.Miura |
|
|
|
N.TakagiMiho | 488(-6) | |
|
10
|
8
|
11
|
4H |
57.0
|
H.Uchida |
|
|
|
T.HayashiMiho | 462(-12) | |
|
11
|
2
|
2
|
5H |
57.0
|
K.Yokoyama |
|
|
|
T.YasudaRitto | 536(-4) | |
|
12
|
4
|
4
|
5G |
57.0
|
T.Eda |
|
|
|
M.HoriiMiho | 426(0) |
STARTING PRICES
| Win |
5
8 |
¥150 ¥330 |
|---|---|---|
| Place |
5
8 7 |
¥130 ¥240 ¥180 |
| Bracket Quinella |
|
¥450 |
| Quinella |
|
¥1,540 |
| Quinella Place |
|
¥630 ¥320 ¥1,030 |
|---|---|---|
| Exacta |
|
¥1,480 ¥1,740 |
| Trio |
|
¥2,560 |
| Trifecta |
|
¥5,410 ¥8,220 |
※Please check the results, odds and other data against JRA official data
POSITIONS AT BENDS
| 1 Corner | 2-6-12(8,9)(5,11)3(1,10)-7=4 |
|---|---|
| 2 Corner | 2-6-12(8,9)(5,11)3,10,1,7=4 |
| 3 Corner | 2,6,12(8,9)(3,5,11)(10,7)(1,4) |
| 4 Corner | (2,*6)12(8,9)(5,7)(3,10,11)(1,4) |
- How to read Positions at Bends
-
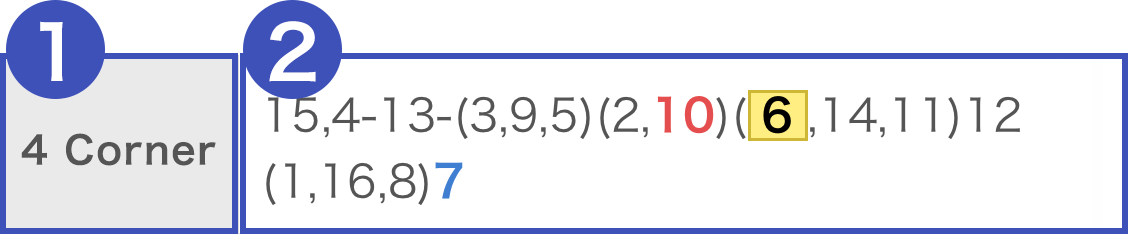
1Label of corners
2Order of horses at each corners.1stis colored in black with gold shade.2ndis colored in blue and3rdin red.
How to read symbols , 1,2,3 means the length between the first and grouped horses with a same symbol are within 1 to 2 length. - 1-2-3 means the length between the first and grouped horses with a same symbol are within 2 to 5 length. = 1=2=3 means the length between the first and grouped horses with a same symbol are over 5 length. () (1,2,3) means a group of horses running in parallel within a length. * (1,*2,3) a horse number with this symbol indicates that this horse is leading a group.
SECTIONAL TIMES
- Pace
- M
| 100m | 300m | 500m | 700m |
|---|---|---|---|
| 7.2 7.2 |
18.5 11.3 |
30.1 11.6 |
42.0 11.9 |
| 900m | 1100m | 1300m | 1500m |
| 53.9 11.9 |
1:06.9 13.0 |
1:18.9 12.0 |
1:31.5 12.6 |
| 1700m | 1900m | 2100m | 2300m |
| 1:44.0 12.5 |
1:56.0 12.0 |
2:07.7 11.7 |
2:19.6 11.9 |
| 2500m | |||
| 2:31.9 12.3 |
Upper Row: Aggregate, Lower Row: Sectionals